ISSN: 2157-7617
Journal of Earth Science & Climatic Change
������
Our Group organises 3000+ Global Events every year across USA, Europe & Asia with support from 1000 more scientific Societies and Publishes 700+ ������ Journals which contains over 50000 eminent personalities, reputed scientists as editorial board members.
������ Journals gaining more Readers and Citations
700 Journals and 15,000,000 Readers Each Journal is getting 25,000+ Readers
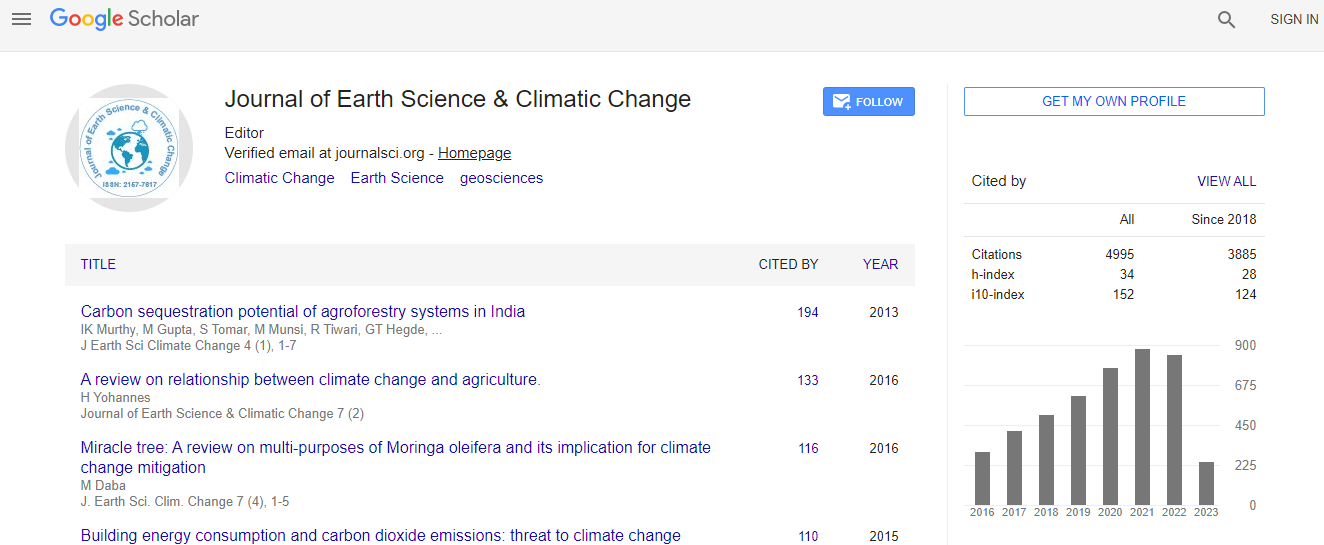
Citations : 5125
Indexed In
- CAS Source Index (CASSI)
- Index Copernicus
- Google Scholar
- Sherpa Romeo
- Online Access to Research in the Environment (OARE)
- Open J Gate
- Genamics JournalSeek
- JournalTOCs
- Ulrich's Periodicals Directory
- Access to Global Online Research in Agriculture (AGORA)
- Centre for Agriculture and Biosciences International (CABI)
- RefSeek
- Hamdard University
- EBSCO A-Z
- OCLC- WorldCat
- Proquest Summons
- SWB online catalog
- Publons
- Euro Pub
- ICMJE
Useful Links
Recommended Journals
Related Subjects
Share This Page
In Association with

Study on method for synthetic precipitation data for ungauged sites using quantitative precipitation model
3rd World Congress on Climate Change and Global Warming
Deanna Jaiho Oh and Hyo-Jun Bae
Pukyong National University, South Korea
Posters & Accepted Abstracts: J Earth Sci Clim Change
DOI: